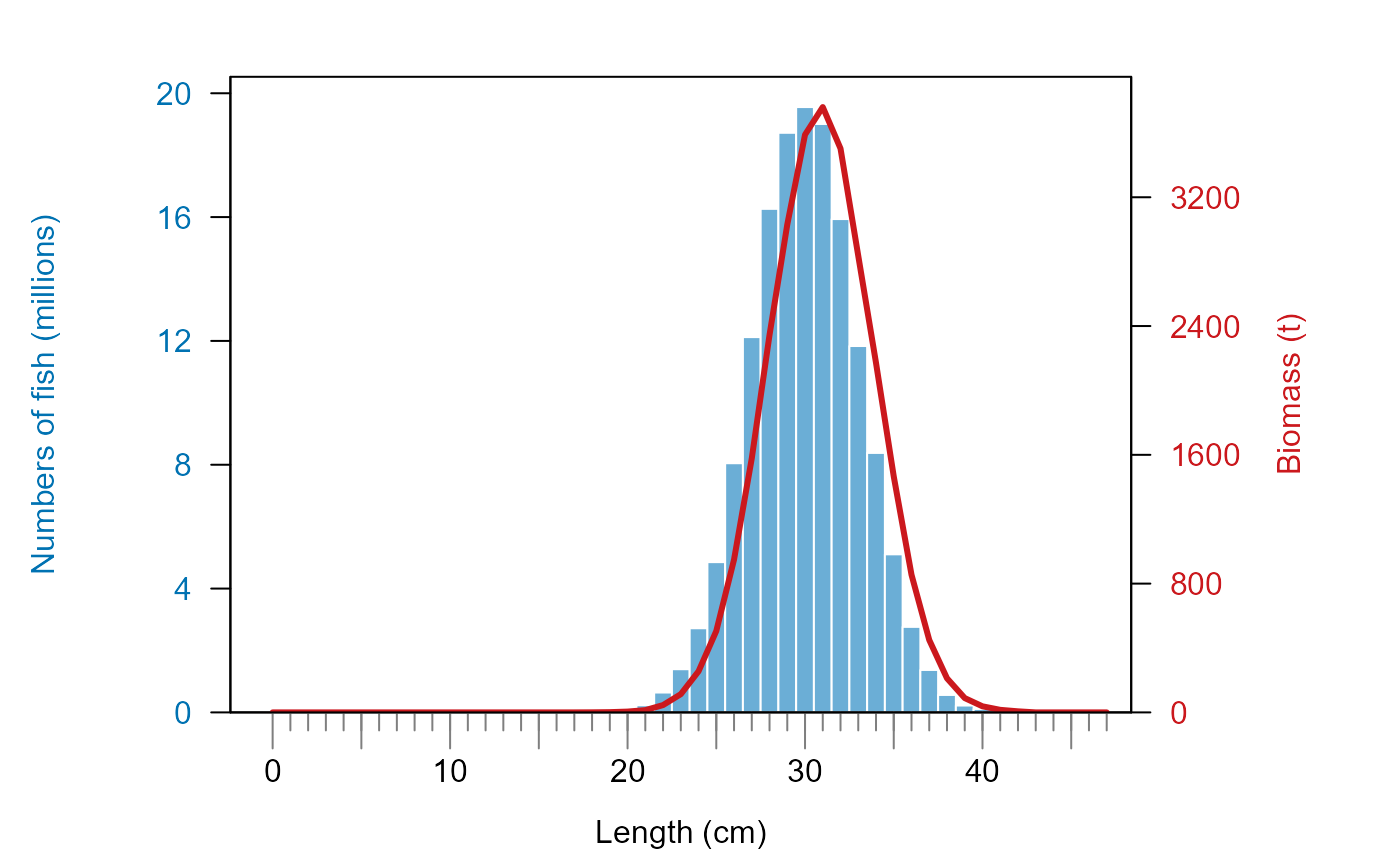
Get biomass- and numbers- by length plots with dual y-axis
plot_biomass_nums_by_length.RdReturns a dual-axis plot with numbers as bars and biomass as lines; each abundance measure is plotted on independent y-axis scales. Plot units are automatically scaled to billions of fish, millions of fish OR thousands of fish/ millions of tons, 1000s of tons OR tons based on the magnitude of the biomass or numbers.
Usage
plot_biomass_nums_by_length(
  length_vector,
  biomass_vector,
  numbers_vector,
  add_totals = FALSE,
  cex_label_size = 1
)
Arguments
- length_vector
A vector of fish lengths (units are assumed to be cm in 1 cm increments). This vector must be equal in length to
biomass_vectorandnumbers_vector.- biomass_vector
A vector of fish weights (units should be KG. Be sure to provide weights in KG!). This must should be equal in length to
length_vectorandnumbers_vector.- numbers_vector
A vector of fish numbers (units should be individual fish. Be sure to provide weights in individual fish!). This must should be equal in length to
length_vectorandbiomass_vector.- add_totals
Option to add the totals as the title of the plot. Default is to not add a title. Set to TRUE if you'd like a title with the total biomass and number values.
- cex_label_size
the font size of the axis labels (default 1.0). These are specified as scaling factors from the default of 1.0 (i.e. 2 is twice as large).
Value
A ggplot plot object. Note that the actual plot is a R baseplot; it is returned as a ggplot object so that it can be more easily integrated into Rmarkdown documents.
Examples
# generate a simulated fish population
lengths <- round(rnorm(mean = 30, sd =3, n = 100000), digits = 0)
weights <- lengths^3 * 0.01
numbers <- sample(c(0, 3e3), size = 100000, replace = TRUE)

# plot it
plot_biomass_nums_by_length(length_vector = lengths,
 biomass_vector = weights,
  numbers_vector = numbers)


# plot it with totals added as text
plot_biomass_nums_by_length(length_vector = lengths,
biomass_vector = weights,
numbers_vector = numbers,
add_totals = TRUE)
# plot it with totals added as text
plot_biomass_nums_by_length(length_vector = lengths,
biomass_vector = weights,
numbers_vector = numbers,
add_totals = TRUE)
